On a Hong Kong project, the first homework is usually the site analysis
🗺️ On a Hong Kong project, the first homework is usually the site analysis. I built a free tool: pick a Hong Kong site and get twelve site analysis diagrams, then pull them apart in 3D.
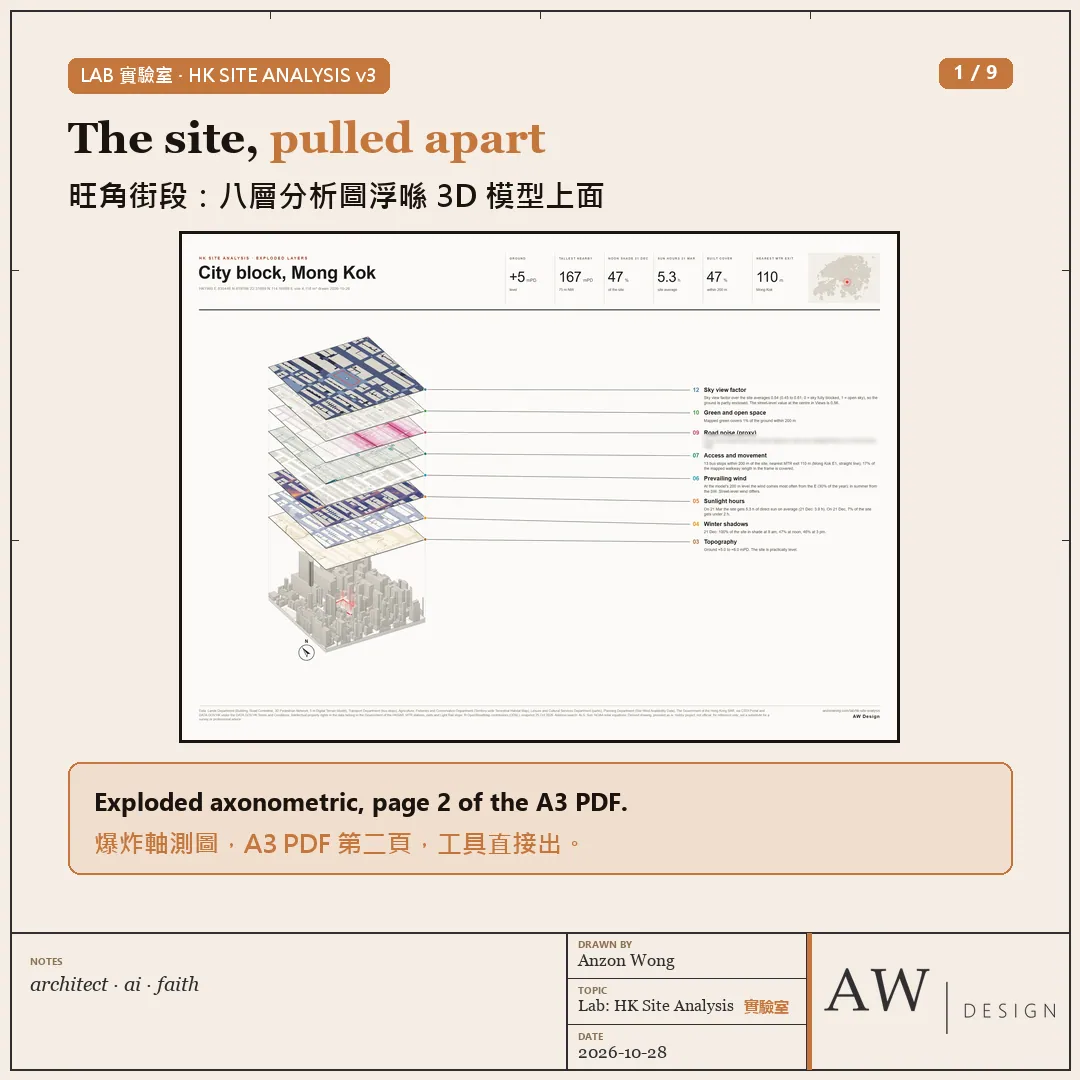
HK Site Analysis (new on anzonwong.com Lab):
・Search an address, click the map, or draw your own site boundary
・Twelve diagrams: figure-ground, building heights, topography, winter shadows, sunlight hours, prevailing wind, access and movement, walking distance, road noise (proxy), green and open space, views and openness, and sky view factor
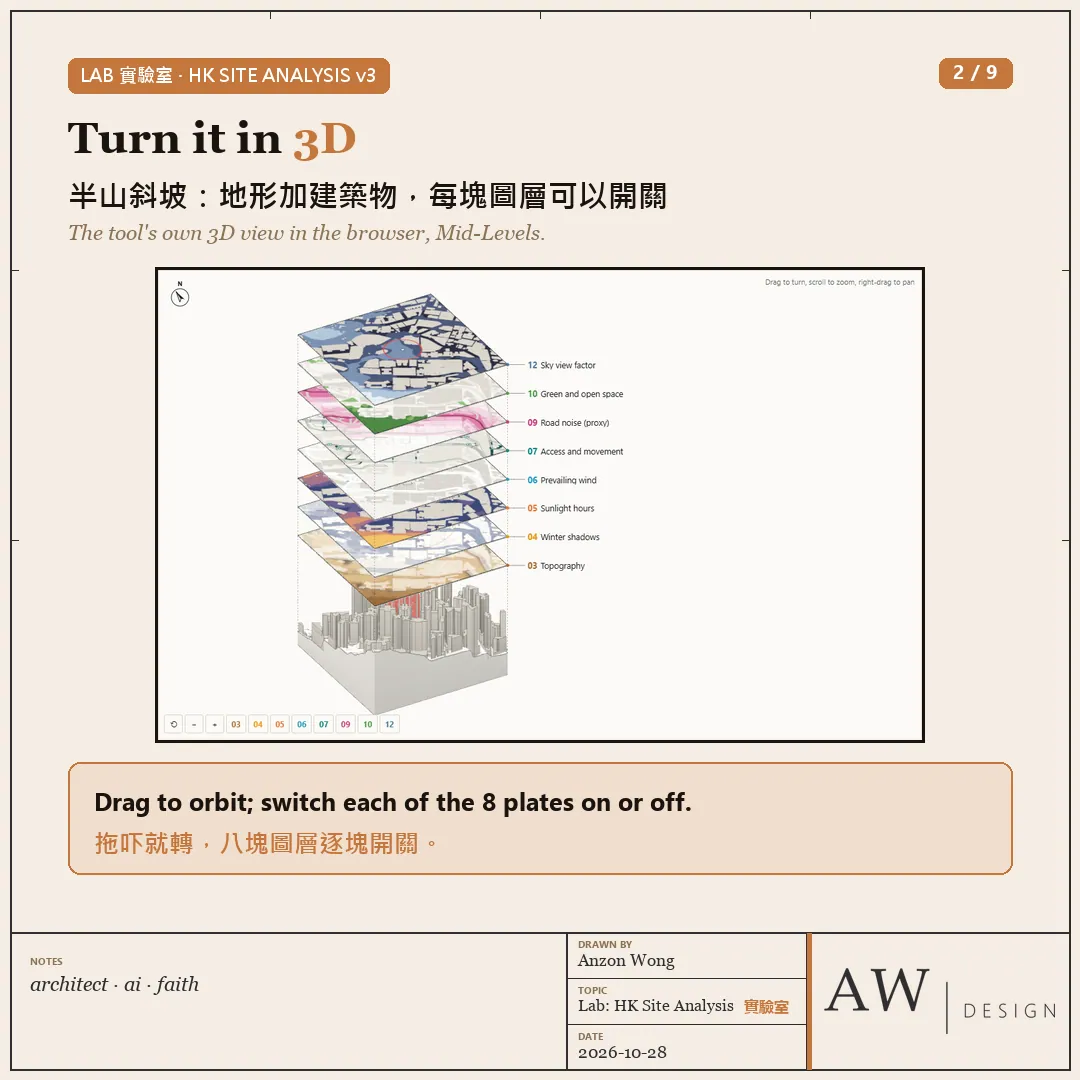
・A 3D model and an exploded axonometric: eight diagram plates float above the buildings and terrain, each one on or off, saved as an A3 sheet
・Four colour styles (Paper, Line, Vivid, Night), square or round frames
・Download an A3 or A2 PDF, a PNG, twelve square images, and DXF and SVG drawings in HK1980 Grid on named layers, ready for CAD
・Free, no sign-in, English and Chinese, runs in your browser
Two test sites:
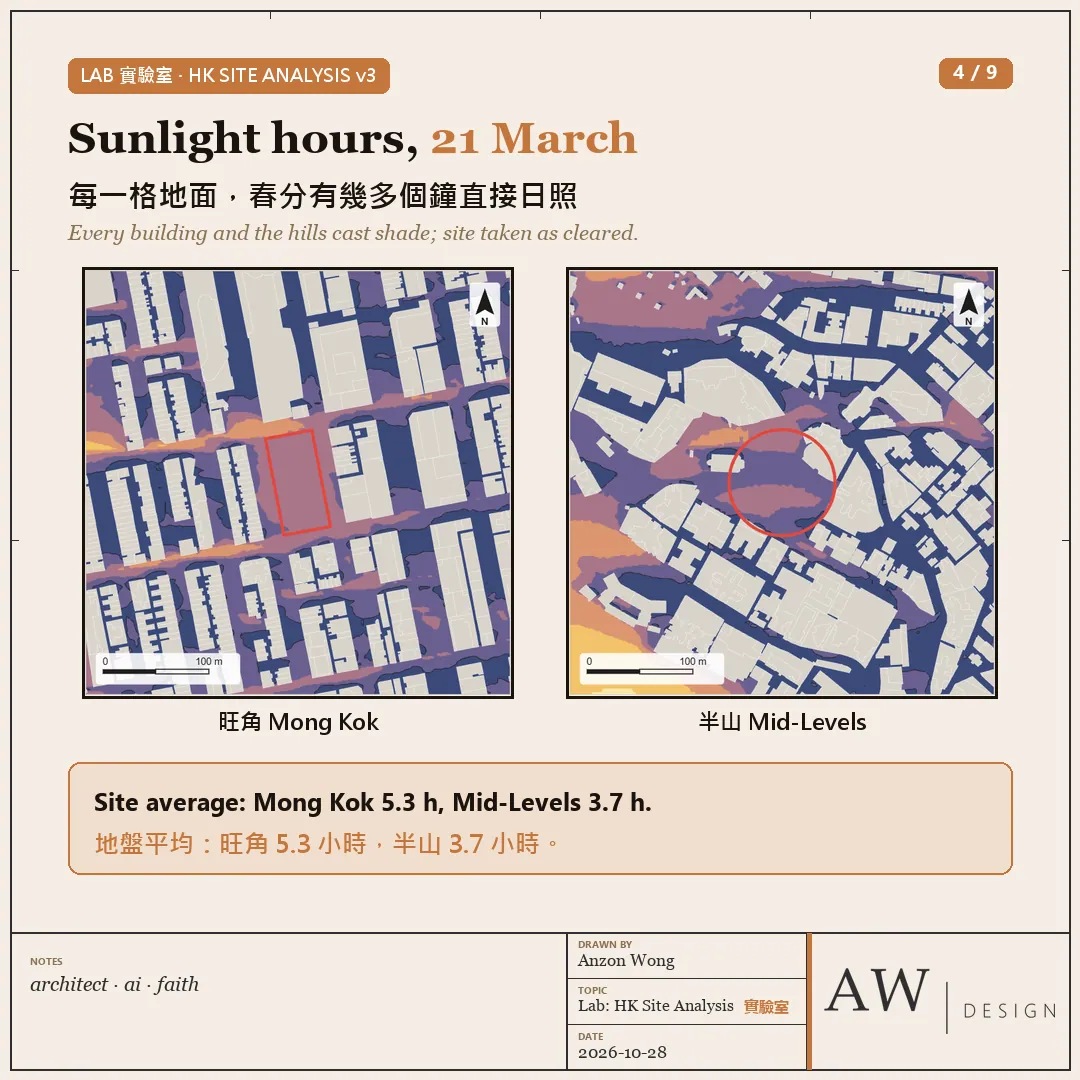
・Sunlight hours on 21 March: a Mong Kok city block averages 5.3 hours of direct sun, a Mid-Levels slope 3.7 hours
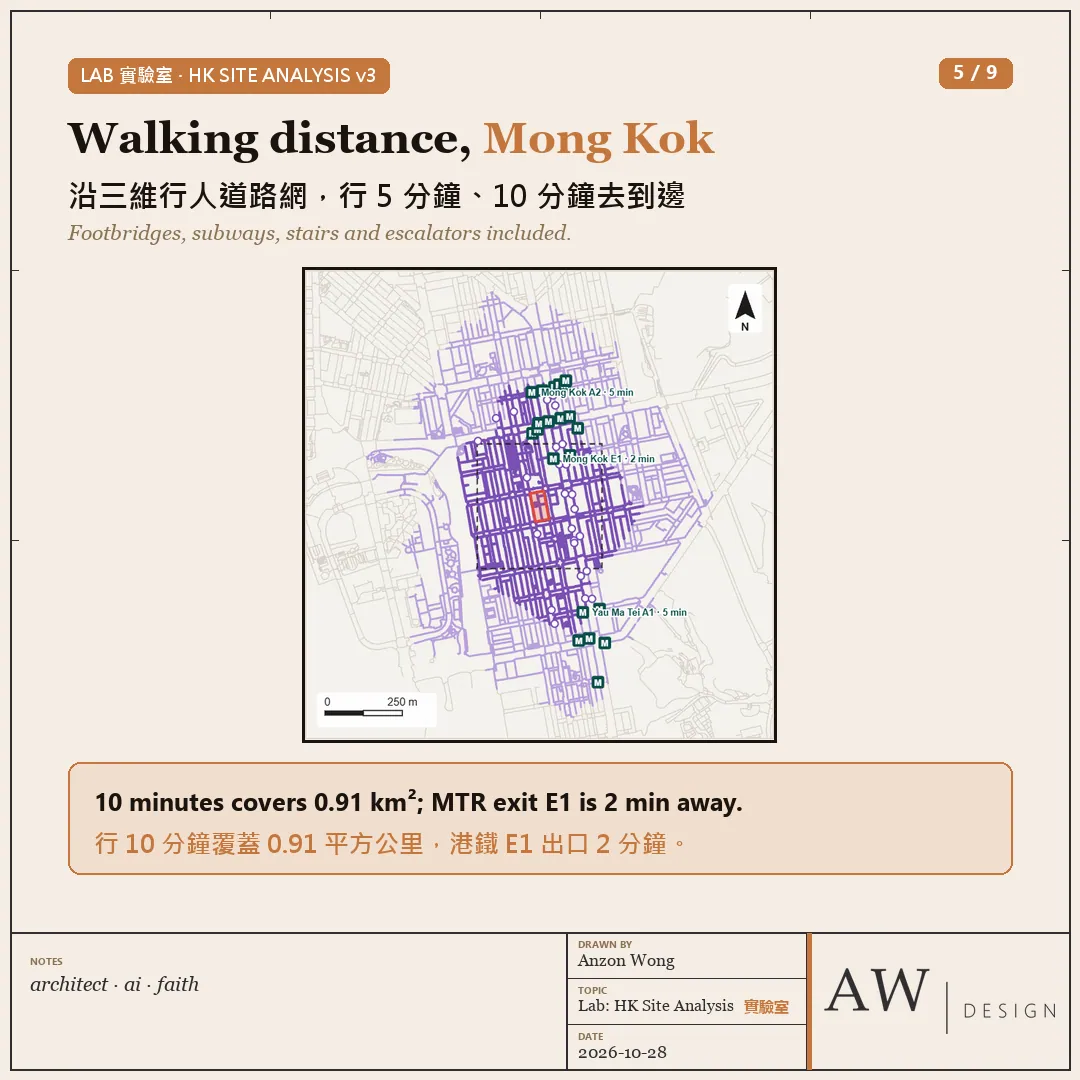
・Walking distance: 10 minutes from the Mong Kok block along the Lands Department's 3D Pedestrian Network covers about 0.91 km²; MTR Mong Kok exit E1 is 2 minutes away
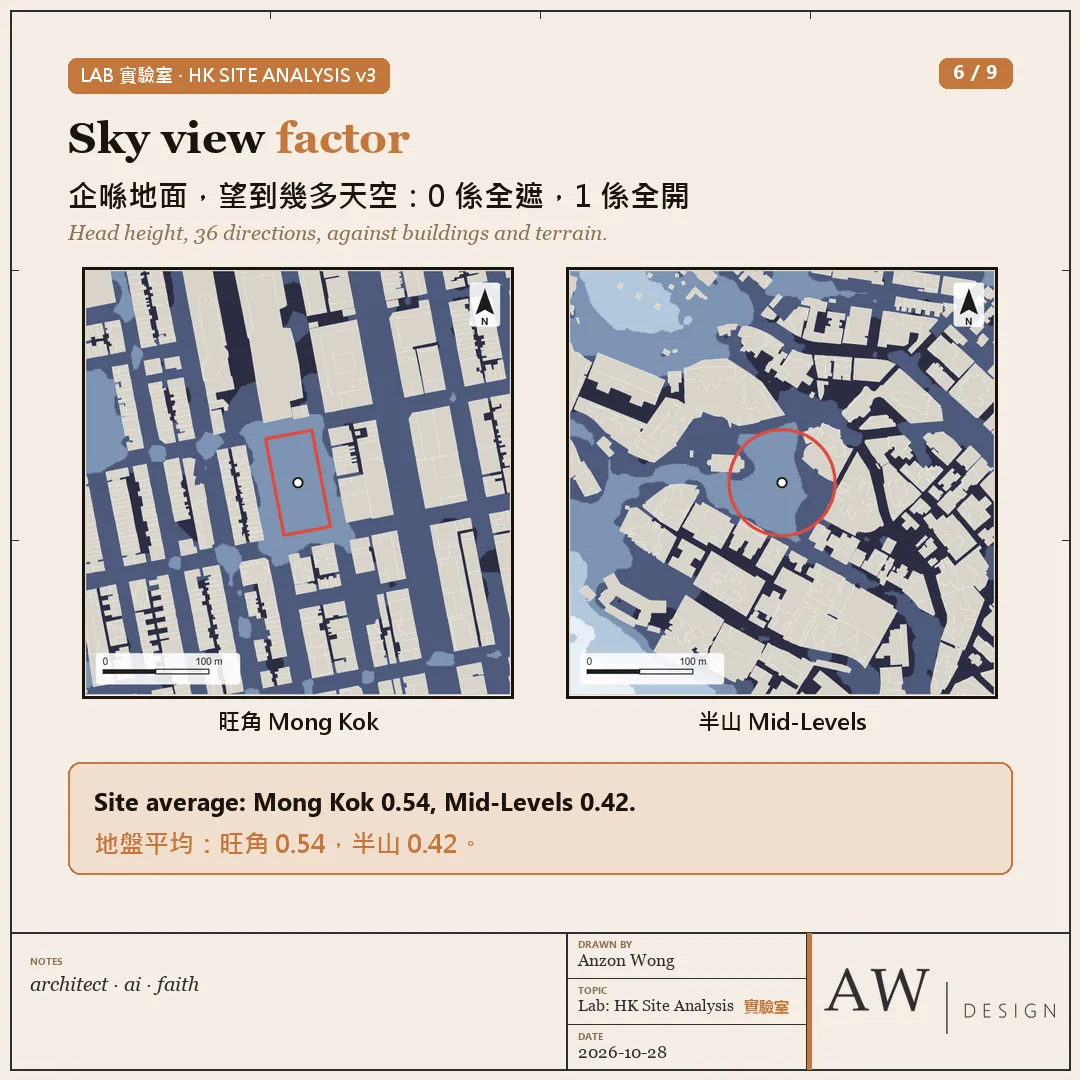
・Sky view factor: Mong Kok 0.54, Mid-Levels 0.42 (1 means open sky)
MTR exits come from an OpenStreetMap snapshot of 25 October.
The data is Hong Kong Government open data from the Lands, Planning and Transport Departments, AFCD and LCSD, through the CSDI Portal and DATA.GOV.HK. MTR exits come from an OpenStreetMap snapshot of 25 October.
How it was made: I set the direction and the drawing style, my AI agent wrote the code and ran the tests; the sun positions were checked against the Astronomical Almanac.
Honest caveats: a hobby project, not official data, not a substitute for a survey or professional advice. Sunlight is direct sun only, with no allowance for cloud; wind is the Planning Department's simulated 2009 data at the 200 m level; noise is a distance proxy only.
Link: https://anzonwong.com/lab/hk-site-analysis/?utm_source=fb&utm_medium=social&utm_campaign=2026-W44
Which diagram would you add for your site analysis? Tell me what you think in the comments 👇